To get to a target allocation for private equity, an investor has to understand how their commitments will translate to valuations over time. Unfortunately, this is not an easy exercise. Experienced investors often have their proprietary models to come up with commitment proposals. Often, these models are based on Monte Carlo simulations (MCS), such as a study by Pinebridge or an article I wrote together with a colleague about the risks in private equity.
More complicated models, such as Monte Carlo simulations, are essential for an investor who wants to build up and manage a private equity portfolio professionally. However, such models are not well suited to grasp the results intuitively and communicate them to others. And this is often as important as the validity of the results. People, me included, don’t feel comfortable making decisions about large sums of money that are based on opaque models. In addition, decision makers in larger organizations are not very familiar with private equity.
How can you give such decision makers an intuitive answer to the question how much one has to commit annually to funds to end up at a certain portfolio value? I have run dozens of private equity portfolios through Monte Carlo simulations, have written my diploma thesis about the allocation of private equity into an overall portfolio by using simulations; yet, if someone used to ask me this question, I could not come up with a simple answer.
Hence, I thought about the issue a bit more and came up with one. Without further ado, let’s get into it.
The idea is to start with the development of the net asset value (NAV) of a typical private equity fund over time. In the following, I use cash flow data from Preqin and for illustrative purposes, only focus on mature buyout funds with a vintage year of 2005 or older. The chart below shows the NAV in relation to the commitment over time for a median buyout fund.
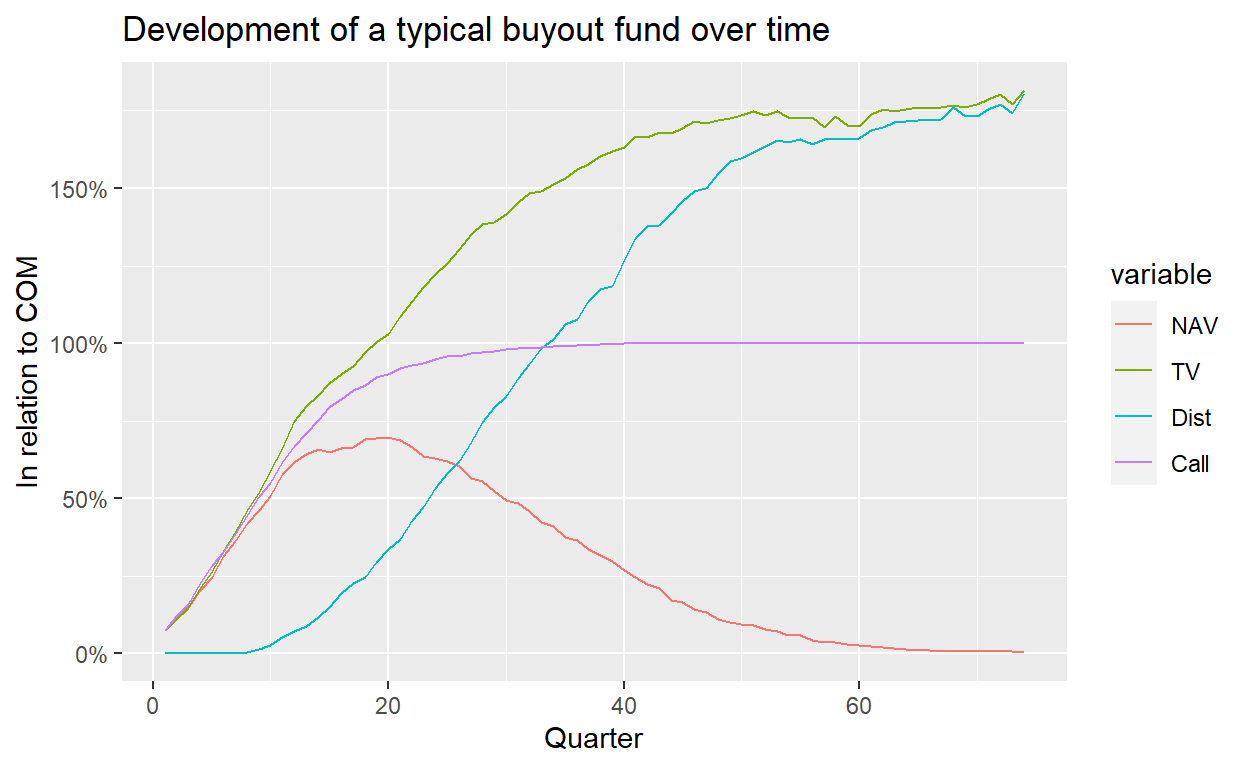
Figure 1: Data provided by Preqin. Only buyout funds with vintage year 2005 or older considered. Median statistics shown.
During the investment period, the NAV increases quickly as the fund manager invests into underlying companies. The NAV peaks in year 5, at the end of the investment period for most buyout funds. Interestingly though, it does not get to anywhere close to the commitment size but starts decreasing around the 75% mark. This might come as a surprise to some, but if you commit USD 10 million to a buyout fund, the unrealized value in this fund will most likely not get close to USD 10 million at any point in the lifetime of the fund. This is not because buyout funds don’t perform, but because they start generating distributions well before the end of their lifetime.
What we can also see from the chart is that a typical buyout fund takes 15 years to be fully realized. To reach a steady state, an investor must commit each year the same amount. After 15 years, the portfolio is then at the point where it consists of a fund in each stage (one-year old fund, two-year old fund, etc.).
All we got to do now is to string together the relevant curves for the funds, with a year difference per fund. The table below shows the built up of the portfolio for the first 10 years.
|
Year
|
||||||||||
|---|---|---|---|---|---|---|---|---|---|---|
| 1 | 2 | 3 | 4 | 5 | 6 | 7 | 8 | 9 | 10 | |
| Fund 1 | 20% | 42% | 62% | 66% | 70% | 63% | 56% | 46% | 36% | 27% |
| Fund 2 | 0% | 20% | 42% | 62% | 66% | 70% | 63% | 56% | 46% | 36% |
| Fund 3 | 0% | 0% | 20% | 42% | 62% | 66% | 70% | 63% | 56% | 46% |
| Fund 4 | 0% | 0% | 0% | 20% | 42% | 62% | 66% | 70% | 63% | 56% |
| Fund 5 | 0% | 0% | 0% | 0% | 20% | 42% | 62% | 66% | 70% | 63% |
| Fund 6 | 0% | 0% | 0% | 0% | 0% | 20% | 42% | 62% | 66% | 70% |
| Fund 7 | 0% | 0% | 0% | 0% | 0% | 0% | 20% | 42% | 62% | 66% |
| Fund 8 | 0% | 0% | 0% | 0% | 0% | 0% | 0% | 20% | 42% | 62% |
| Fund 9 | 0% | 0% | 0% | 0% | 0% | 0% | 0% | 0% | 20% | 42% |
We can also plot the NAV curves for individual funds and show the sum of these individual curves, which is nothing else as the value of the whole portfolio. The value of the portfolio reaches its steady state after 15 years, which is when the commitment into the first fund is fully realized.
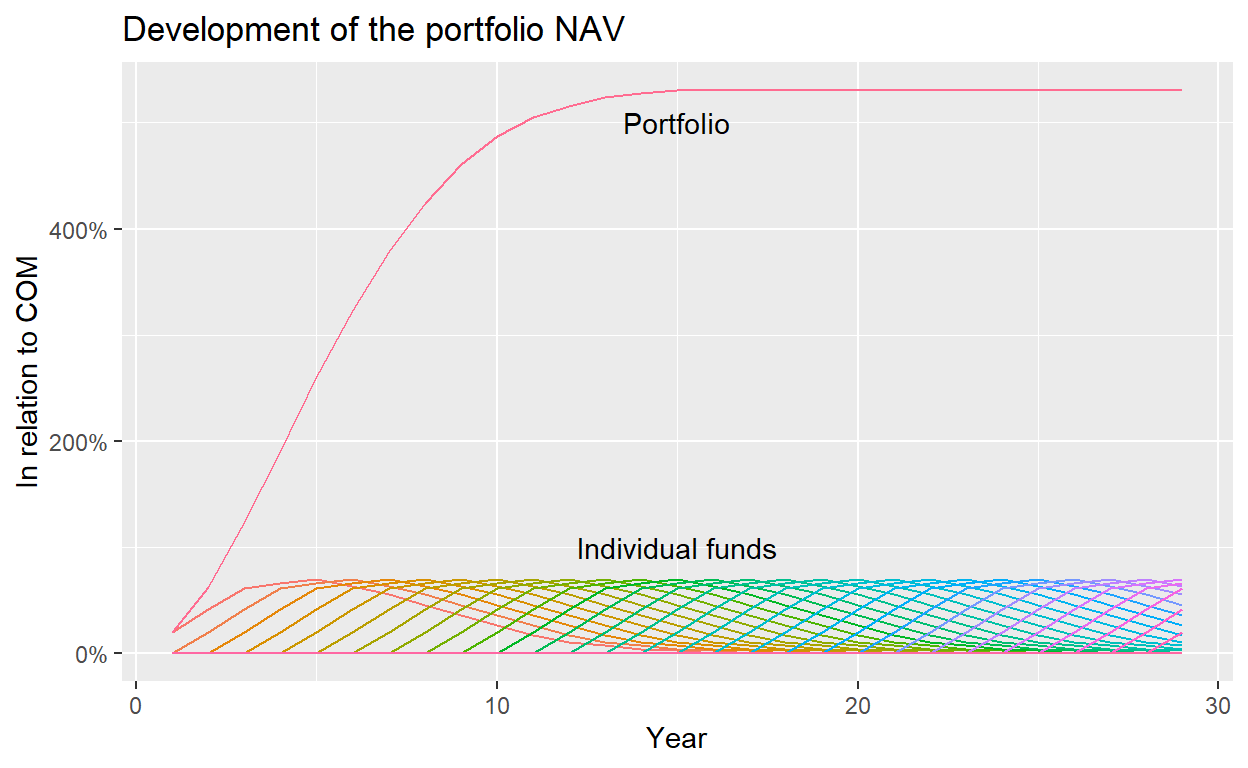
The value of the portfolio is slightly above 5, based on a one unit of annual commitments. As an example, an investor who wants to get to a roughly USD 500 million private equity portfolio (in terms of NAV) should commit around USD 100 million each year. Of course, this rule is dependent on the assumption about the development of the NAV for a private equity fund. Above, I used the median curve of buyout funds from the Preqin universe.
Below, I show the NAV development for different percentiles from the Preqin data set. Notice the large dispersion: while the median curve reaches it maximum before 75%, there are close to 10% of buyout funds that actually end up with an NAV larger than the commitment size.
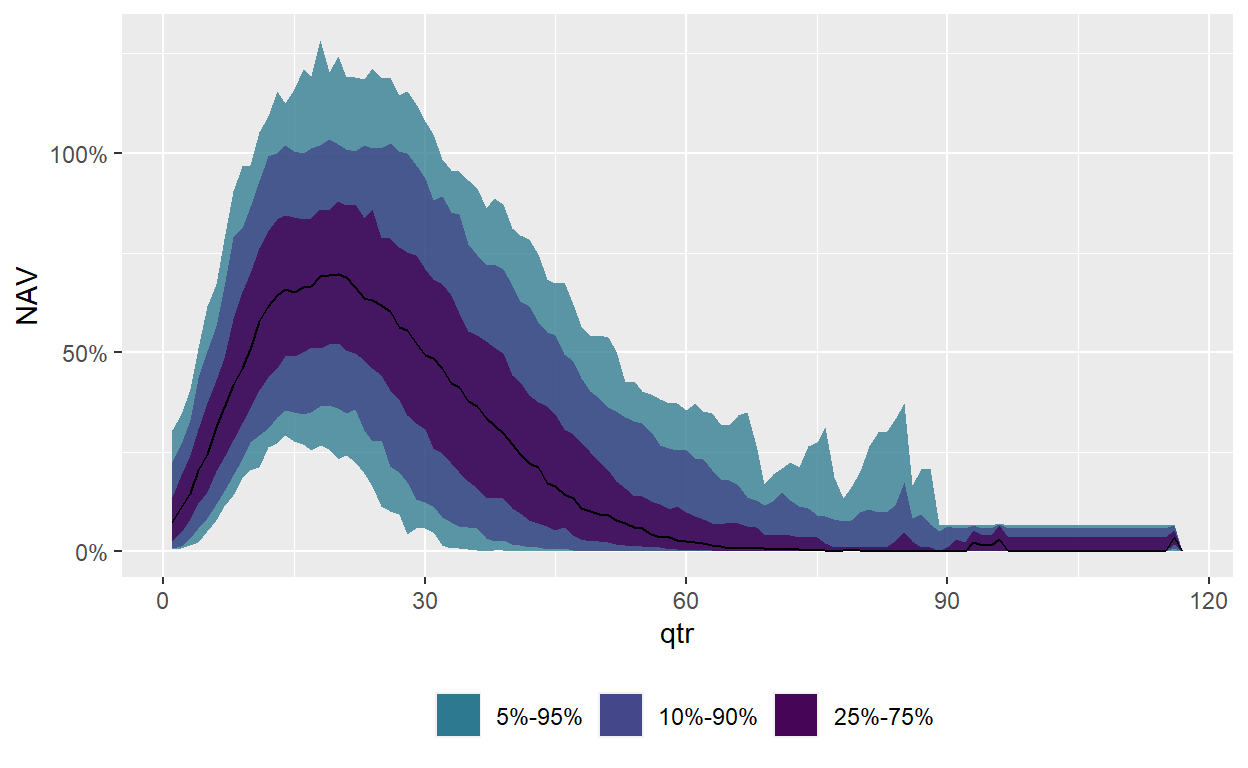
This is why diversification is so important: if an investor commits to only one fund, the outcome could be anything. However, the more diversified the portfolio becomes, the higher the likelihood that the portfolio ends up closer to the average.1
To summarize: In this post, I have shown a simple trick to understand what annual commitments are required to end up with a certain private equity allocation. The trick is to string together the same NAV curve of a representative fund until a steady state is reached. In the steady state, the sum of all individual NAVs is the portfolio NAV. I have further shown that in case of a typical buyout fund, the factor from annual commitments to portfolio NAV is 5.3. An investor who commits USD 10 million per year would end up with a portfolio NAV of USD 53 million when the steady state is reached.
Another way to derive this result is by calculating the mean of the NAV curve for one fund over the 15 years, which is 35% for the median buyout fund in our sample. In absolute numbers and for a USD 10 million commitment, that means that throughout the lifetime of the fund the NAV is on average USD 3.5 million. As we have 15 funds in the steady state in parallel, the portfolio NAV is USD 53 million.2
Of course, an investor who wants to start investing in private equity should rely on more sophisticated models. But this simple heuristic is a good starting point to get a better understanding how commitments and portfolio valuations are linked.
Careful: the average is not the same as the median and due to the right-skewed distributions in private equity, the average will be higher. However, we want here a big picture analysis: Which ballpark commitments do I have to write to end up at a certain allocation? To answer this question, the subtle difference between median and average is not that important.↩︎
Don’t get caught up on the number of funds. All you need is an average ratio of NAV to commitment. If you have that, it is irrelevant if the commitment is given to one or ten funds per year. The ratio might change depending on the number of funds, but I want to emphasize again that this approach just wants to support an investor getting a simple understanding of why certain commitment amounts are needed to get to a certain private equity allocation.↩︎