One of the key differences between private and public equity is that the latter provides investors with daily updates on their asset values based on actual transactions as the stocks are sold and purchased on exchanges around the globe, taking into consideration all available information, both on the specific company and the overall market. In contrast, a fund investment’s valuation is typically only based on an actual transaction between a seller and a buyer when fund managers acquire the company and when they sell it.
In between, the valuations that fund managers provide to their investors are based on their internal valuation methodology, but there is no guarantee whatsoever if a buyer would be willing to pay this valuation. They might get it right, or they might under- or overestimate the value of the investment. But why would they do this? Well, first of all, just as all of us, fund managers are humans and they make mistakes. It might be that despite their best efforts, they misjudge what others would pay for their investment. In addition, they might have their reasons to distort the valuations. For example, Brown, Gredil, and Kaplan (2019) find that top-performing fund managers likely understate their valuations - why annoy your investors with higher valuations than subsequent proceeds? - while some struggling fund managers inflate valuations to increase their fundraising chances.1 Also, the percentage of fund managers using mark-to-market valuation has most likely also increased over time.
To summarize, unrealized investments are valued by fund managers and these valuations will most likely deviate in one way or the other from the true, fair market value that could be achieved in an arm’s length transaction. There is evidence that this deviation is not just independently distributed around the true value, but that there are systematic biases in these deviations that could inflate or underestimate the true performance of a fund. Finally, historically mark-to-market valuation was much less established in the early days of private equity, which might have resulted in much lower unrealized returns early on in a fund’s lifetime.
Hence, in this blog post, I look closer at the mark-ups of private equity funds early on in their lifetime up to 5 years. After 5 years, a fund is typically in the harvesting period and many valuations are already based on ongoing exit processes with third parties.
To do so, let’s look at the TVPIs of all U.S. buyout funds per vintage year after 4, 8, 12, 16, and 20 quarters. The idea is not to look at every boxplot individually, but rather try to identify any positive relationship between the vintage year and the TVPIs. Interestingly, and against my own prior belief, I don’t see such a relationship.
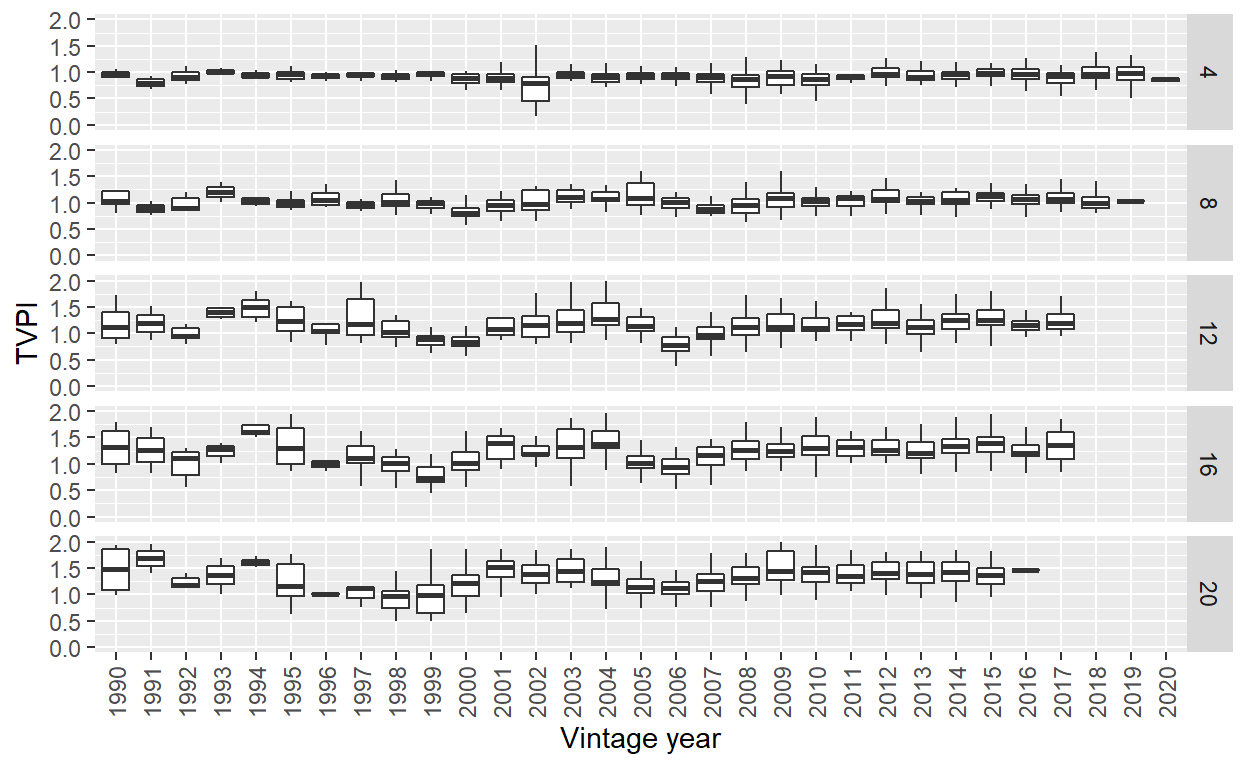
Figure 1: Dispersion of TVPIs for U.S. buyout funds, grouped by vintage year at different points in time over the fund life: after 4, 8, 12, 16, and 20 quarters (from top to bottom). Only funds with TVPI 2x or lower considered. Data from Preqin.
Looking at the first row in the chart, funds in all vintage year groups were marked very close to 1x after 4 quarters. There is no clear trend that younger funds are valued up earlier than their predecessors have been in the past. One change that is apparent over time though is that the dispersion of TVPIs becomes wider for younger funds. Up till 2006, the fund valuations after 4 quarters have been very close to 1x for almost all funds within each vintage year group as there is barely a box visible and the whiskers are very small. Since then, the boxes have become wider and 2018 and 2019 vintages have whiskers extending above 1.25x.
After 8 quarters, the story doesn’t change much. Funds are still valued close to 1x and the dispersion within each vintage year group is relatively small. One change compared to the top row is that there is some variability across the vintage year groups. Most importantly, one could detect recessions from this chart as both the 2000 and 2006 median fund were marked below 1x.
One year later, there is now a clear pattern to identify poor vintage years such as 1999/2000 funds, which were hit by the burst of the dot-com bubble, and 2006/7 funds, which invested prior to the global financial crisis. However, in relation to the question of this blog post - Do managers mark up their funds more aggressively? - there is again no indication that they do. Sure, funds with vintages 2008 and younger are typically marked above 1x after 3 years in their lifetime. But they also invested during times of good overall market sentiment and the valuations do not look aggressive by any standard. For none of the vintage year groups is the median TVPI over 1.25x. And more importantly, there are also plenty of older vintage years in which funds stood well above 1x after 3 years, such as funds from 1995 to 1997 and from 2001 to 2004.
The picture does not change much when we look after 16 and 20 quarters: the performance per group seems to be mostly driven by the overall economic environment, rather than by changes in the valuation process over time.
Of course, this analysis cannot prove that fund managers have not become more aggressive or pro-active in managing their valuations. For example, it could be that older fund investments performed much better than younger funds and only the fact that fund managers have become more aggressive with their valuations led to similar multiples early on in the fund’s lifetime. Furthermore, I have shown that 2018 and 2019 vintages have seen a very strong start and it will be interesting to repeat the analysis in the future. Maybe fund managers have become much more aggressive, but it doesn’t show quite yet in the data. I also cannot exclude the possibility that the mark-up in earlier funds were simply driven by actual exits of some underlying investments, rather than by write-ups by the fund manager without any imminent exits.
Ideally, one would have underlying investment level data to understand better the drivers of the valuations of unrealized investments in private equity to look further into this topic. However, just by looking at the fund TVPIs over time, there is no apparent trend that younger funds are marked up to higher multiples early on in their life.
Interesting side note: investors see through this!↩︎