Overall, private equity funds generate attractive returns over the course of their lives.1 In this blog post, I’m looking further into the question when this value creation happens? This is an important question to ask, especially in my line of work as a secondary buyer: as returns can only come from the price a buyer pays for a fund or further value creation, knowing at what age of a fund the value creation is most likely to happen helps a buyer to better price fund interests.
In the following, I use cash flow and NAV data of private equity funds from Preqin. I focus on buyout funds and exclude all funds with a vintage year younger than 2010 as such funds still have meaningful value creation ahead of them.
To start with, I calculate the annual return in year \(t\) for a fund \(i\) as follows:
\[ Ret_{i,t} = \frac{NAV_{i,t} + Dist_{i, t}}{NAV_{i,t-1} + CC_{i,t}} - 1, \]
where \(NAV_{i,t}\) is the reported NAV of fund \(i\) at the end of period \(t\), and \(CC_{i,t}\) and \(Dist_{i,t}\) are the capital calls and distributions from and to the investors by the fund from \(t-1\) to \(t\).
The boxplot chart below shows the dispersion of annual returns over the first ten years of a buyout fund.2 In the first three years, a typical buyout fund does not report positive returns. As a matter of fact, most funds have a negative return in their first year when not many investments have been made yet, these that have been made are valued at cost, and the fund already charges management fees and asks investors to pay for the establishment expenses.
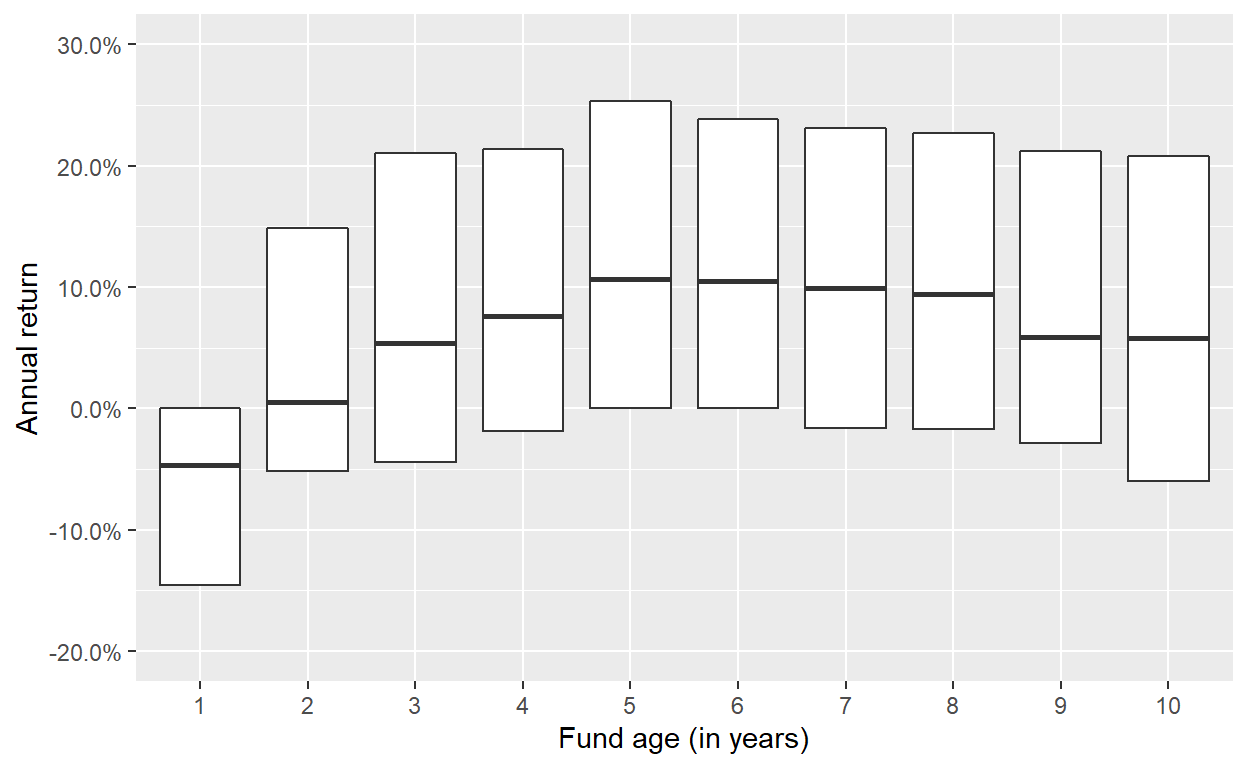
Figure 1: Dispersion of annual returns of buyout funds over the first 10 years of their lifetime. The lower and upper hinges correspond to the first and third quartiles of the annual returns, the line in the middle to the median. Data from Preqin.
Starting with year 4, funds start reporting positive returns with consistently strong years from year 5 to 8 where the median fund reports a return of 10% p.a. and more than one quarter of funds having returns of 10% p.a. or higher. This is the most important phase of value creation, often called the “harvesting phase” for a private equity fund. In this phase, the fund is out of the investment period, the fund managers are working on their operational initiatives and preparing the underlying investments for their exits. In year 9, returns come down meaningfully, although they continue to be positive for most of the funds. At this age of the fund, the strongest performing investments have already been sold successfully and the remaining ones have an issue in one way or the other. These funds are often described as “tail-end.”
Nadauld et al. (2019) report in their paper that secondary buyers pay the highest prices, in relation to the NAV, for funds that are four to nine years old. This resonates well with the results shown here: such funds are the most attractive, as they still have lots of value creation ahead of them, while most of the fee leakage has already been paid as it is front-loaded by private equity funds. For tail-end funds, secondary buyers require a larger discount as they cannot expect their returns to come from further value creation of the funds.
So far, I have looked at the returns independently of the current state of the economy. An interesting follow-up question is if the value creation pattern described above changes in case of recessions. One hypothesis could be that more mature funds are not so much impacted anymore by the overall economy, as a larger share of the remaining value is non-investment related items such as cash, escrows, carry provisions, etc. To test this hypothesis I re-plot the boxplot for two particularly bad years of private equity, 2002 and 2009.
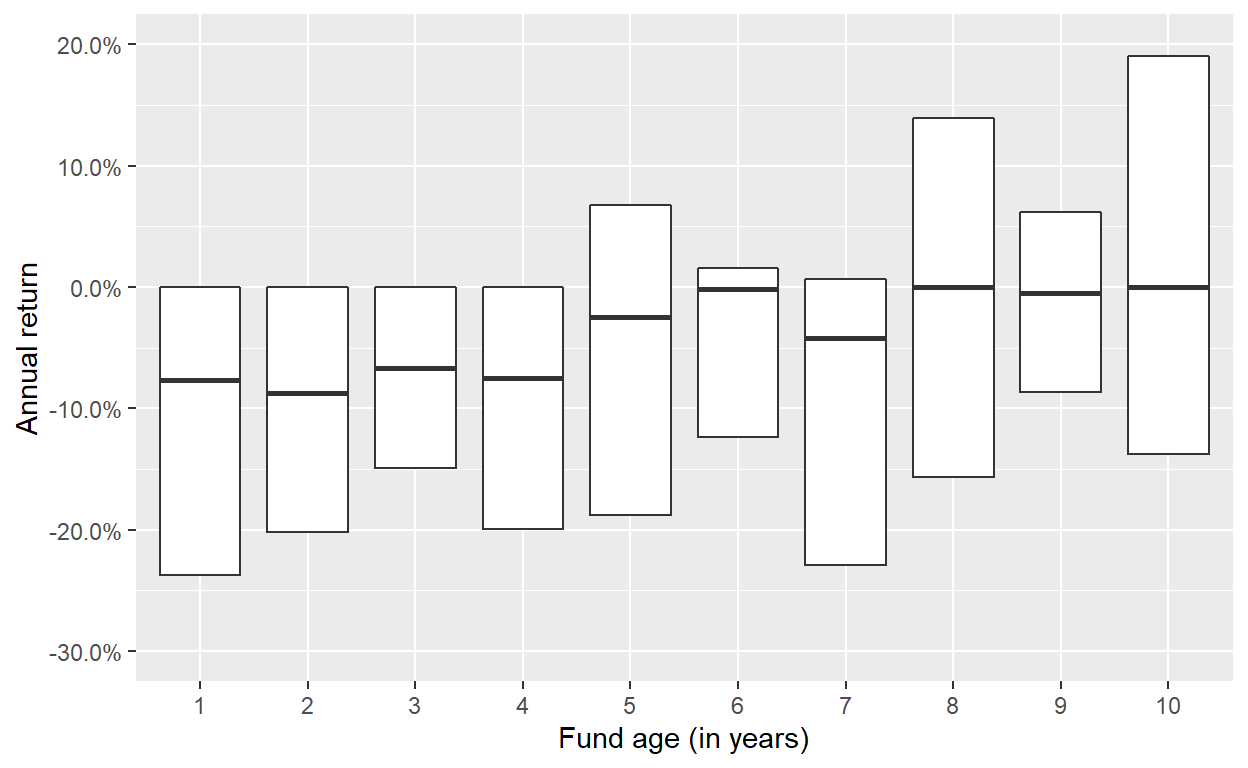
Figure 2: Dispersion of annual returns of buyout funds over the first 10 years of their lifetime. The lower and upper hinges correspond to the first and third quartiles of the annual returns, the line in the middle to the median. Data from Preqin. In this chart, only the annual return of 2002 is considered.
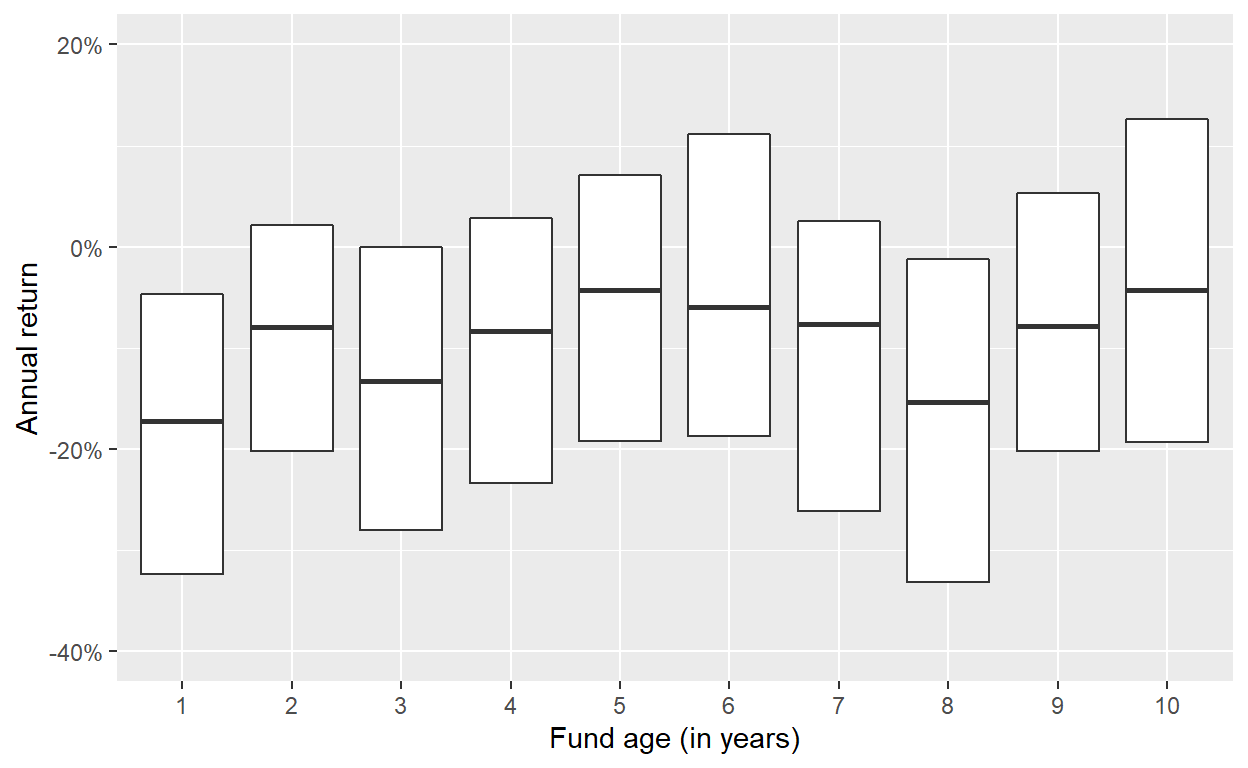
Figure 3: Dispersion of annual returns of buyout funds over the first 10 years of their lifetime. The lower and upper hinges correspond to the first and third quartiles of the annual returns, the line in the middle to the median. Data from Preqin. In this chart, only the annual return of 2009 is considered.
Let’s start with 2002, where funds still in the investment period reported rather large negative returns on average, while more mature funds had better median returns around 0%. Overall, the patterns is very comparable to the one described above. For the 2009 cohort, the results are more mixed with both verry young and quite mature funds being strongly impacted, while funds around 5 to 6 years did reasonably well.
To summarize, investors in buyout funds should not expect great returns early on, but should get excited at the end of the investment period of what is yet to come. This pattern seems to hold up even in times of market mayhem.
For example, Harris, Jenkinson, and Kaplan (2014) report average multiples and IRRs for their sample of buyout funds of 14% and 2.0x across the vintage years.↩︎
Note: I had a bug in my code that I fixed on Jan 30, 2022, which changed the plots. The overall patterns were unchanged though.↩︎